We can check CPU utilization by using CPVIEW Utility. For more information refer “sk101878“
1) Open the putty to take ssh
2) Go to Expert Mode
command : clish>expert
3) Run below command to check which CPU core take high CPU utilization.
command : [Gateway or Mgmt]#cpview
CPVIEW utility is a Check Point command which also help to see statistical data that contain both general system information (CPU, Memory, Disk space) and information for different Software Blades (only on Security Gateway). The data is continuously updated so we can monitor live.

Basically its showing top 3 CPUs which currently utilize more as compare to other CPU core
Now if you want to see the utilization of all the CPUs then you can use “TOP” command.
Run “top” command to find out the which CPU highly utilized
command : [Gateway or mgmt]#top + press 1
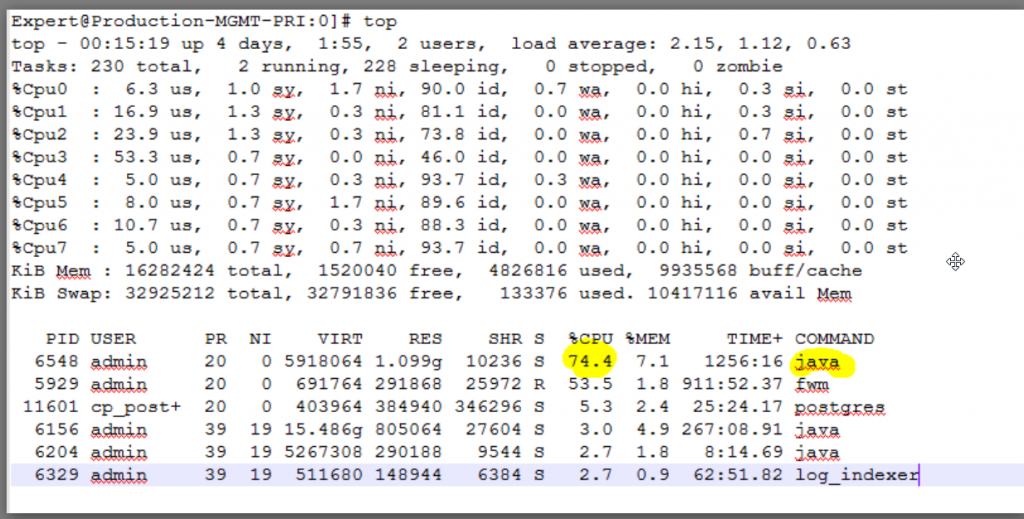
Here on below you can see the utilization of Firewall Workers and also the all CPUs core utilization. So basically on below all my CPUs core are Ideal (showing between 70% to 90%) which is really good during the production time.

Below is the different output from 26000s Appliance which having more than 32 cores with Hyper Threading enable.

Now if we want to know that which process is take High CPU which really important to check when CPU utilization is concern.
So Run “top” command to find out the which process is take high CPU
command : [Gateway or mgmt]#top
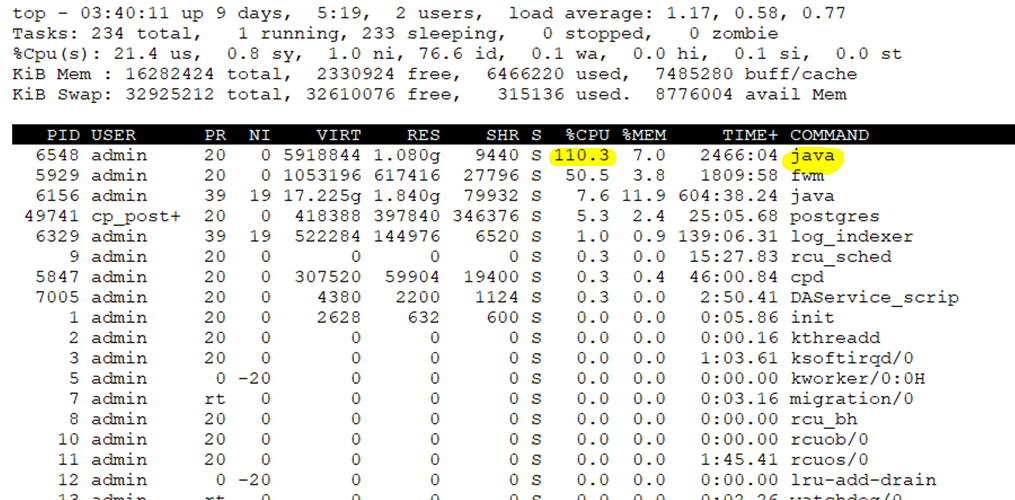
On below snap basically you need to check the “COMMAND” , “%CPU” & “%MEM” tab which we can monitor the CPU and Memory utilization which currently utilize with respect to that service.

Query 1:

On above Java process takes the CPU but it goes beyond 100% (like 110%). How it can be beyond 100% ?
Answer:
“By default, “TOP” command displays CPU usage as a percentage of a single CPU. On multi-core systems, you can see percentages of CPU usage are greater than 100%. You can toggle this behaviour by hitting Shift + i while top is running to show the overall percentage of available CPUs in use”
On above environment base on the output we have 8 CPU (cores) so we have the capacity of 8×100=800% (if we execute top or top +1, lets assumes it a single CPU ) So in our case if
To calculate lets star so here Java is consuming 110×100/800 = 13.75 % of Available CPU capacity.
So there is no need to worry about the CPU usage as it is under limit.
Query 2:
How can I check past CPU utilization to understand if any outage happen during ?
Answer:
Yes we can use the CPView History command (cpview -t … ) to find out the history data. Refer “sk163804” for more details. We can also export the CPVIEW history file by generating the File.
To generate the CPVIEW history file run the below command
[Expert@Gateway]#cpview history export

Exported DB will automatically store into /var/log/CPView_history/

history daemon(HISTORYD) will restart during the time which will not cause fail-over

Query 3:
What should I need to do if my Firewall Workers take high CPU ?
Answer:
First need to check “fw ctl affinity -l” to find out how many SND core we have and how may FW Workers core then by using “TOP” or “cpview” we get to know that which CPU core take high CPU. Base on that we will fine-tune the CoreXL configuration to reduce the utilization.
Query 4:
What I need to do if Any Check Point services will take high CPU ?
Answer:
If you see any check point services like for example in Management server “fwm” take high utilization then you can first refer some check point official SK to find the solution.
Most of the time to resolved the issue I am restarting that particular services which take high amount of CPU but it’s not necessary that issue get resolved every time. Some time I am also doing CPSTOP and CPSTART (Warning: Not to be perform on Production hour) or restart the machine. For example in Management Server if “Java” service take high CPU then this kind of case it’s not necessary that restarting the services resolved the issue may be you need to check the JAVA Heap memory and also the physical memory utilization.
High CPU Utilization also might be the reason that some recent activity done on Gateway or Management Serer like installed the latest Jumbo hotfix or upgrade the gateway or management sever to a latest OS version. Maybe you recently enable some blade.
High CPU utilization on Management server will some time cause the Gateway to locally store the logs($FWDIR/log).


Leave a Reply